用于生成One平台实验图的脚本及使用方法

每次做One平台的实验,输入坐标绘制图像真是件折磨人的事,昨天晚上突然想自己写个脚本来实现这件事。从此画图无忧,哈哈哈哈哈。

python初学者,下面代码是一边查语法书一边写出来的….哈哈哈哈。

绘图脚本

1
2
3
4
5
6
7
8
9
10
11
12
13
14
15
16
17
18
19
20
21
22
23
24
25
26
27
28
29
30
31
32
33
34
35
36
37
38
39
40
41
42
43
44
45
46
47
48
49
50
51
52
53
54
55
56
57
58
59
60
61
62
63
64
65
66
67
68
69
70
71
72
73
74
75
76
77
78
79
80
81
82
83
84
85
86
87
88
89
90
91
92
93
94
95
96
97
98
99
100
101
102
103
104
105
106
107
108
109
110
111
112
113
114
115
116
117
118
119
120
121
122
123
124
125
126
127
128
129
130
131
132
133
134
135
136
137
#!/usr/bin/python
# -*- coding: UTF-8 -*-

import os, sys
import re
import numpy as np
import matplotlib.pyplot as plt
from collections import OrderedDict, defaultdict

dict = {"delivery_prob": 9, "response_prob": 10, "overhead_ratio": 11, "latency_avg": 12, "latency_med": 13,
"hopcount_avg": 14, "hopcount_med": 15, "buffertime_avg": 16, "buffertime_med": 17}


########################
# 文件目录
path = r"F:\One平台\reports\reports"
#path = r"F:\One平台\reports\921添加相似度不加ACK"
# 画图的纵坐标与横坐标的名称
COLNAME = "latency_avg"
ROWNAME = "Buffsize"
# 比较指标 ==>比如 deliver_prob
norm = dict["latency_avg"]
##########################


def getfilename():
# 获得目录下所有的文件名
allfiles = os.listdir(path)
# os.path.getmtime() 函数是获取文件最后修改时间
#allfiles = sorted(allfiles, key=lambda x: os.path.getmtime(os.path.join(path, x)))
files = []
for file in allfiles:
if file.endswith(r".txt"):
files.append(file)
return files


def getalgoname():
files = getfilename()
# 将算法的名称存储到algo_name中
algo_name = set()
for f in files:
#algo_name.add(re.search(r'^([A-Z]*[a-z]*){2}', f).group())
algo_name.add(re.search(r'\d{1,5}', f).group())
#print(algo_name);
return algo_name


def getdata():
# algodict = dict{}
global target
files = getfilename()
algomap = {}
for file in files:
# 打开文件
f = open(path + "\\" + file)
# 正则匹配 截取符合下列规则的字符串
# 截取数字之前的字符串
name = re.search(r'([A-Z]*[a-z]*){3}', file).group()
# 截取文件名中的浮点数
para = re.search(r'[0-9]*\.?[0-9]+', file).group()
read_buf = []
# 读取文件中所有的数据
for r in f:
read_buf.append(r)
# 如果读取的文件是空的就continue
if len(read_buf) <= 1:
continue
# 读取list中的数据,并且用split分割一次(2部分)并且取第二个元素
str = read_buf[norm].split(':', 1)[1]
# 并将其分割成只含数字字符串的list
target = (str.replace("\n", "").replace("\r", "").replace(" ", ""))
# 当name不存在algomap中就新建一个{} 去存储 para 和 target
if name not in algomap.keys():
algomap[name] = {}
# 这里相当于dict{"":{}}
algomap[name][float(para)] = target
return algomap


def painting():
algomap = getdata()
# 折线的颜色
color = ["#F4606C", "#7B68EE", "#40E0D0", "#F4A460", "#B5495B", "#BEEDC7", "#D1BA74", "#FB966E", "#FFC408"]
#折线的形状
marker = [r"-o", r"-*", r"-^", r"-v", r"-D", r"+", r"x", r"<", r">"]
# 图的名称
plt.figure('DTN experimental data fig')
ax = plt.gca()
# 设置x轴、y轴名称
ax.set_xlabel(ROWNAME)
ax.set_ylabel(COLNAME)
cnt = 0
# x的界限
x_min = sys.maxsize
x_max = -sys.maxsize - 1
# y轴的界限
y_min = sys.maxsize
y_max = -sys.maxsize - 1
for key in algomap:
x_list = []
y_list = []
for k in sorted(algomap[key]):
x_min = min(x_min, k)
x_max = max(x_max, k)
y_min = min(y_min, float(algomap[key][k]))
y_max = max(y_max, float(algomap[key][k]))
x_list.append(str(k))
y_list.append(algomap[key][k])
print(x_list)
print(y_list)
x_list = list(map(float, x_list))
y_list = list(map(float, y_list))
# 画连线图,以x_list中的值为横坐标,以y_list中的值为纵坐标
# 参数c指定连线的颜色,linewidth 指定连线宽度,alpha指定连线的透明度
ax.plot(x_list, y_list, marker[cnt], label=key, color=color[cnt], linestyle='-', linewidth=2, alpha=0.9)
cnt += 1
# diff_x x轴的为上界和下界之间的差值
diff_x = x_max - x_min
dir_min_x = x_min - diff_x / 8
dir_max_x = x_max + diff_x / 8
# diff_y y轴的为上界和下界之间的差值
diff_y = y_max - y_min
dir_min_y = y_min - diff_y / 8
dir_max_y = y_max + diff_y / 2
# 设置X轴的范围
plt.xlim(dir_min_x, dir_max_x)
# 设置y轴的范围
plt.ylim(dir_min_y, dir_max_y)
# plt.lengend() 生成图例,为了帮助我们展示每个数据对应的图像名称
# loc 固定图例的位置 prop 设置图例的属性
plt.legend(loc="upper right", prop={'size': 7})
plt.show()


if __name__ == '__main__':
painting()

绘图脚本的使用方法

环境

查看自己python现在在用的解释器是否安装了matplotlib包,我会提供一个自动安装matplotlib的脚本,使用这个脚本安装的前提条件是你安装的pycharm都是默认安装,最主要的一点是不要改当前使用python解释器的路径。(如果你已经很熟悉怎么去切换python的解释器以及安装python包的过程,上述直接无视)

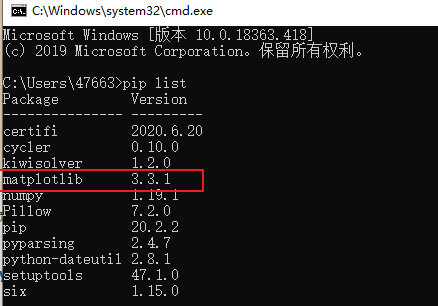
自动化安装的脚本auto_matplotlib.bat,直接双击执行即可。再按windows+R输入CMD,在CMD中输入pip list,查看matplotlib包是否安装成功。若安装成功,如红色框图所示.
使用方法

path 是你生成 reports 的路径(path是每次读取reports的路径)
COLNAME 是画图的纵坐标的名称
ROWNAME 是画图的横坐标的名称

norm 是你指定的比较指标,是在上面的 dict中直接复制替换即可.
综上所述🏉如果已经指定好了path 路径,每次实验只需修改COLNAMEROWNAMEnorm

path是每次读取reports的路径

使用的注意事项

  1. 由于我只选取了8组颜色与线段的类型,一次实验对比最多最多只能有8种。
  2. 要保证 reports 中的报告是能够正常换行的。一个指标是一行,而不是不能换行的。
  3. 在自定义给算法命名的时候切忌不要使用数字,比如生成报告的名称不要取 mytest1类似于这样
    的名称,而尽量使用 mytestA否则在读取报告的时候会出现被程序误解的困难
  4. 生成的reports不要使用中文!!

第二版

解决第一版存在的两个问题:

  1. 无法读取报告名字中的浮点数
  2. 无法在报告文件夹中包含其他类型的文件
  3. 增加实验组的对比上限,从原来最多做6组对比上升到8组

第三版

解决第二版存在的一个问题:

  1. 图例在图中不固定会穿插到绘图的空白处,现已固定在绘图的右上角处,一般来说如果数据正常绘制的线段不会与图例重叠。

如果你有什么好的设计想法以及需要完善功能也可以与我一起讨论,并对上述代码进行改进。